Building key performance indicators (KPIs) in every organization helps track the company's milestones.
But of course, it is necessary to understand all the basic concepts and everything that goes with creating KPIs and metrics for your database dashboard.
We'll buid your first application for you. At no extra cost.
Let us build your first business application for free. Go from an idea to an application in under 2 weeks.

What are KPIs and metrics?
- A KPI shows how well a part of a business is doing toward long-term goals or outcomes.
- Metrics give us information or measurements about many things but may only sometimes be directly related to our main business goals.
KPIs and metrics need to have consistent monitoring in every organization. This is to:
- Ensure optimal performance
- Maximize uptime and availability
- Allocate resources and plan capacity
- Enhance security
- Maintain data integrity
- Optimize costs
- Audit for compliance
- Facilitate proactive maintenance
- Improve development and deployment
- Enhance decision making
However, choosing the proper metrics varies depending on the type of organization. For example, a quota-based work will differ from an output-based work.
In 2022, Statista asked marketing managers, directors, vice presidents, and chief marketing officers (CMOs) from 35 countries to rate their companies' income as a KPI.
Eighty-seven percent of those interviewed said that web/mobile analytics and customer satisfaction measures came in second and third, respectively.
Choosing the right metrics to keep an eye on what is most important and make decisions based on data that aligns with your organization's goals.

In this blog, we will understand the KPIs and metrics essential for your database dashboard, how to build your KPIs, and how to use these metrics for proactive maintenance.
Foundational concepts
Metrics and KPIs are often used interchangeably, but they have different meanings and functions:
Metrics
Metrics are measurable ways to keep track of and rate the progress of a specific activity, process, or operation.
Scope: Metrics cover many different parts of an operation, from performance to operational to incidental metrics.
Purpose: To give data points or measurements across many areas.
Example: Number of website visitors
Key Performance Indicators
KPIs are a type of metric. A company will focus on essential metrics to reach its strategic goals or see specific results.
Scope: Less broad measurements Some KPIs are chosen because they directly relate to an organization's goals and are usually few.
Purpose: To see how well a part of the business meets strategic goals or achieves desired outcomes.
Example: Conversion rate from website visitors to registered users
To choose the right KPIs, know your organization's goals and pick metrics that will best show how close you are to reaching those goals. Metrics help you get a complete picture of different parts of operations or performance.
Database performance and business outcomes
The link between how well a database works and how well a business does is straightforward and robust. Databases are often the most essential part of modern businesses, so how well they work can significantly affect many business areas.
They are interlinked for plenty of reasons:
- User experience and satisfaction: A good database guarantees quick data retrieval and transaction completion. This means that pages will load faster, apps will respond quickly, and user interactions will be smoother.
- Operational efficiency: Databases that work well make internal operations easier. Reporting, analyzing data, and using internal applications get faster and more reliable.
- Scalability and growth: As a company grows, it must deal with more data. A database that works well can handle more data so the business can grow without technical problems.
Businesses have integrated the use of KPIs and metrics for various areas.
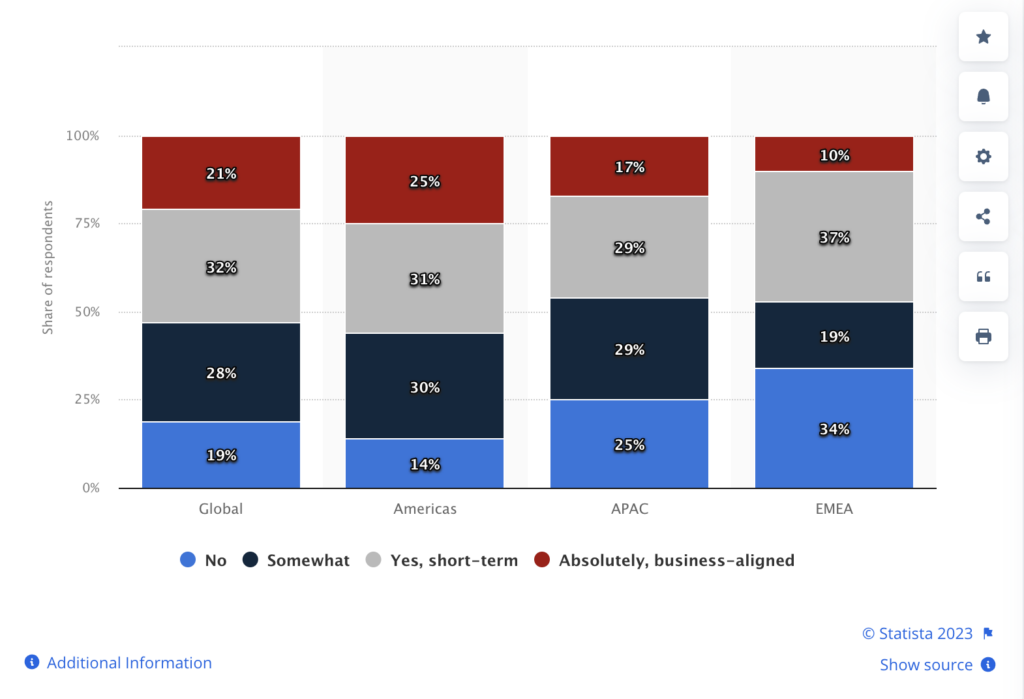
The same Statista survey found that 21% of those who answered said their companies had set up KPIs to track their personalization efforts.
European and Middle Eastern (EMEA) businesses had the smallest share. Businesses from the Americas had the largest share.
How to build your KPIs
The process of making KPIs is pretty simple. Setting the goal is the first thing that needs to be done. Second, determine the best way to measure it and when it will be tracked (called the frequency).
After this basic structure, goals or aims and where the data will come from are added.
There are five questions that you can consider when creating KPIs:
- What do I need to do to fix it? Choose one for the company that is bothering you and stopping you from moving forward.
- How can I tell if I'm making progress? Lead indicators help you see where you're going, not where you've been.
- How can I tell if the SMART Red, Yellow, and Green success standards are being met?
- When it gets off track, Green, what should I do to get it back on track?
- What do I do when it's yellow or red? From the data, what can I do to make it better?
Creating a KPI dashboard
There are several steps to making a KPI dashboard, starting with knowing what the business goals are and ending with regularly visualizing and changing the data.
Here is a step-by-step guide on how to make KPI screens that work:
Understand the business objectives
Write down the main goals of your project or business. These goals will help you choose which KPIs to track.
Identify relevant KPIs
Pick KPIs that are very close to the goals you have for your business.
Select a dashboard tool
Choose based on how well it works with your data sources, how easy it is to use, how well it can display data, and how easily it can be expanded.
Design with the audience in mind
Stress simplicity and clarity. User confusion and lost information can happen when the screen is too crowded.
Set up data sources
Link your panel tool to the data sources it needs. This could be third-party apps, databases, or files.
Choose an effective visualization method
Different visualizations work better for different types of data and KPIs:
- Looking for long-term trends? Use line charts.
- Figures that look like pies show relationships between parts and wholes.
- Bar charts let you compare things in different groups.
Make it interactive
Let users change the periods, filter the data, or drill down for more detailed views on the dashboard.
Regularly update the dashboard
Consistently update the data. This could happen in real-time, every day, every week, or every month, depending on the KPIs.
Test and iterate
Get feedback from people who use the dashboard. This way, you can find places where people get confused or add more KPIs.
Access control and sharing
Set up suitable access controls based on how sensitive the data is.
Follow these steps to create a KPI dashboard that is useful, insightful, and actionable, giving decision-makers the power to make choices that are in line with business goals.
Essential database performance metrics
Keeping an eye on how well your databases work keeps your systems healthy, efficient, and reliable.
Here are some critical performance measures for databases to think about:
- Latency: The time it takes for a data packet to connect from one place to another.
- Cache hit ratio: The number of cache hits divided by the total number of cache looks up.
- Error rates: The number of mistakes or mistakes that the computer makes.
- Query response time: It tracks how long it takes to run a query.
- Transaction rate: The number of activities that happen in a given time.
Organizations can make sure their databases work well, find problems before they get worse, and get the most out of their resources by keeping an eye on these measures. Even someone with financial degrees can help alleviate these problems and turn things around for the firm.
Each metric may be less necessary depending on the database system, its use, and the business goals.
Using database metrics for proactive maintenance
Anticipating problems and fixing them before they get worse or cause unexpected downtime is what proactive maintenance is all about. A forward-thinking way to keep your database in great shape is to use database measures for preventative maintenance.
Here's how to use database metrics to do upkeep before it breaks:
Establish baselines
- Keep track of standard performance measures when the load is normal.
- Compare the current estimates with the baseline regularly to find outliers or signs of slowing performance over time.
Check index health
- Use index usage data to find indices that need to be used more or are missing.
- To keep performance at its best, rebuild or arrange a fragmented index regularly.
Set up alerts
- Set up notifications for certain limits, like high CPU usage, fast disk space consumption, or a high error rate.
- Early tips help you deal with possible problems faster.
Monitor growth rates
- Keep an eye on data growth metrics, like how much disk space is used or how many records are in essential tables.
- Figure out how much room you will need in the future and add more resources before they run out.
Use database measures for preventative maintenance, so you can make sure that operations run smoothly and make your database infrastructure last longer.
This method reduces unexpected downtimes and reactive firefighting, creating a more stable and effective database environment.
Create essential KPIs and metrics for your database dashboard
Database performance and business outcomes are interlinked to gain more user experience and satisfaction, operational efficiency, and scalable growth.
Choosing the right, insightful, and actionable KPI and metrics for your database dashboard can be easy if they are aligned with the business goals.